


Audytor CH

Audytor CH program is designed for graphic-aided design of new heating systems, adjustment of existing installations (e.g. in insulated buildings), as well as design of cooling systems (network od ice-water pipes). An important feature is the ability to place multiple sources heating or cooling medium in one design, which enables e.g. design of four-pipe system.


New features in SET 7.4
In the newest version of program Audytor SET new functions and several enhancements have been implemented to speed up the installation design process.
Main changes:
- Surface systems - a ceiling system and a wall system
- Calculations of resulting cooling efficiency of the installation
| READ MORE |
Surface systems
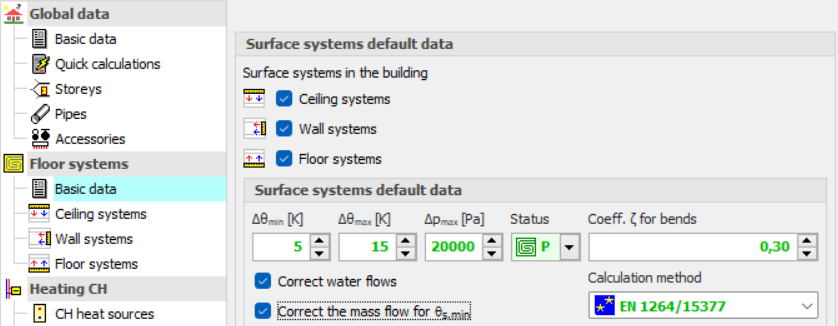
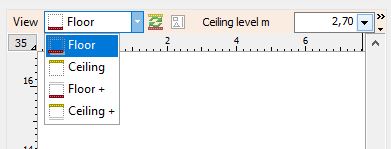
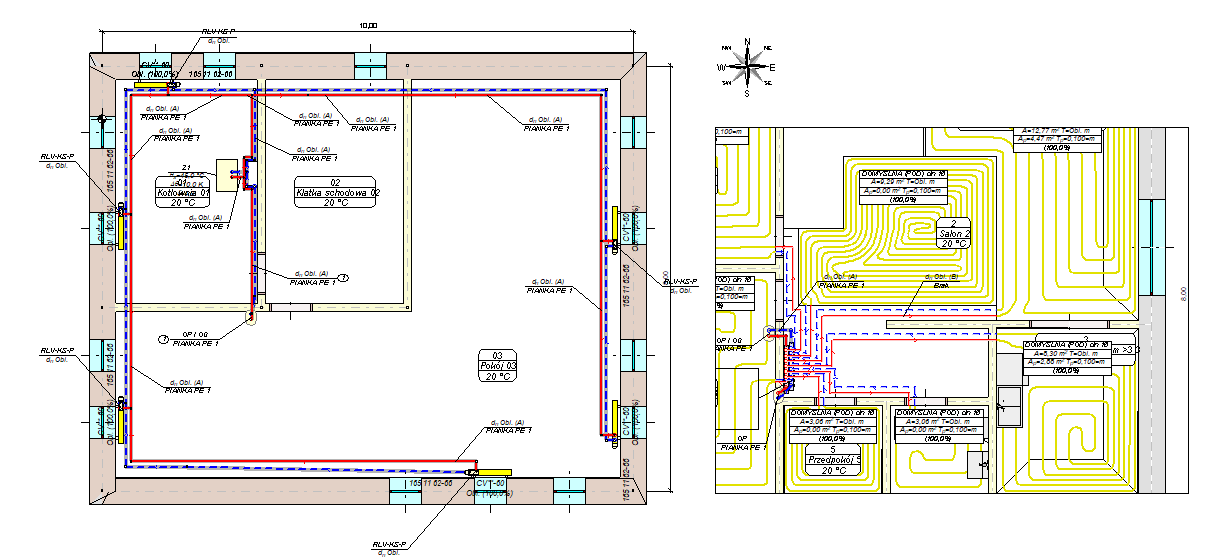
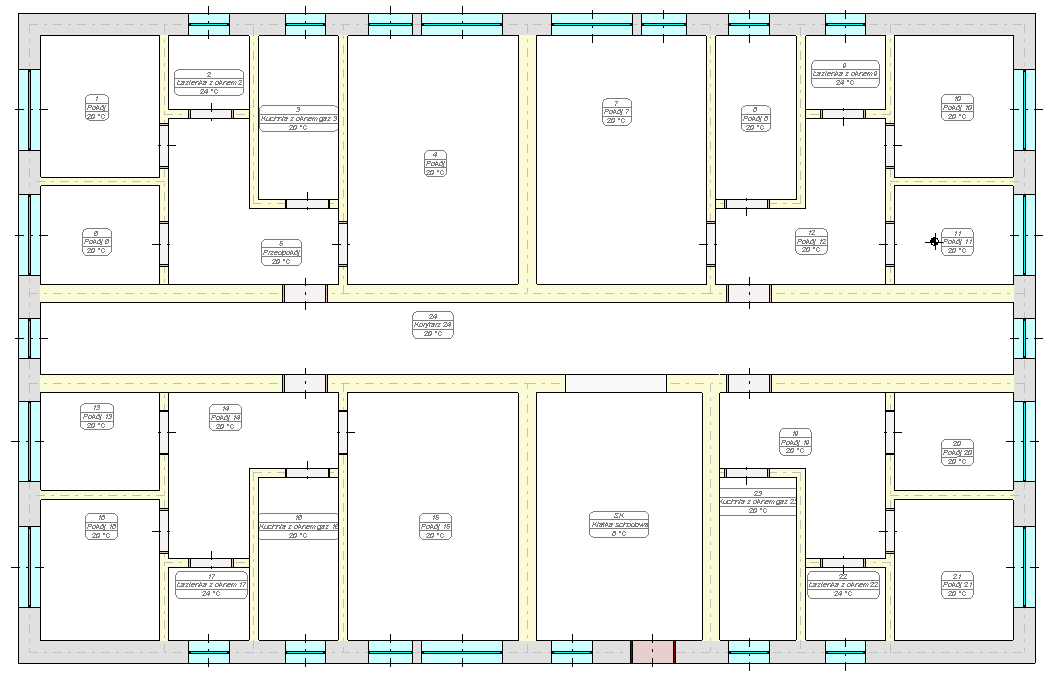
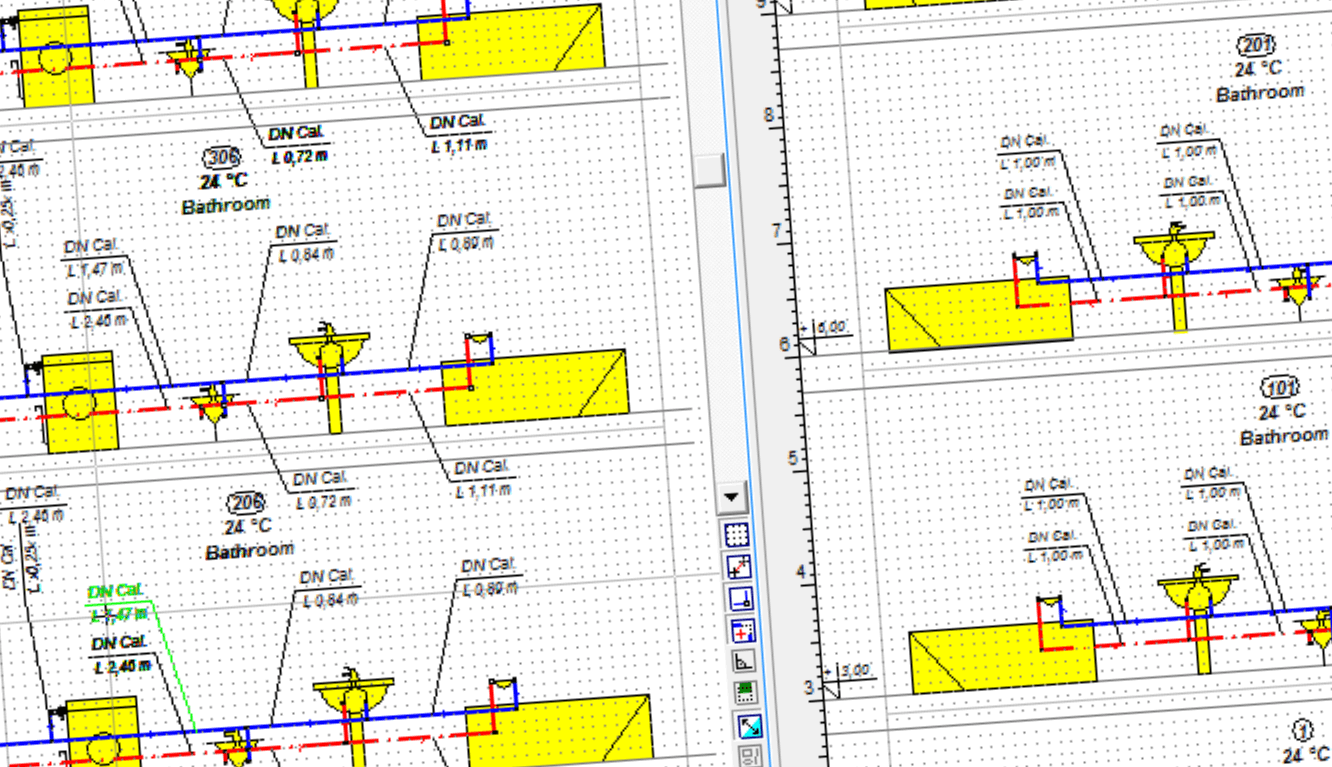
The Audytor SET 7.4 program introduced the possibility of designing surface systems - a ceiling system and a wall system. Among the surface systems, we also will find the well-known floor system
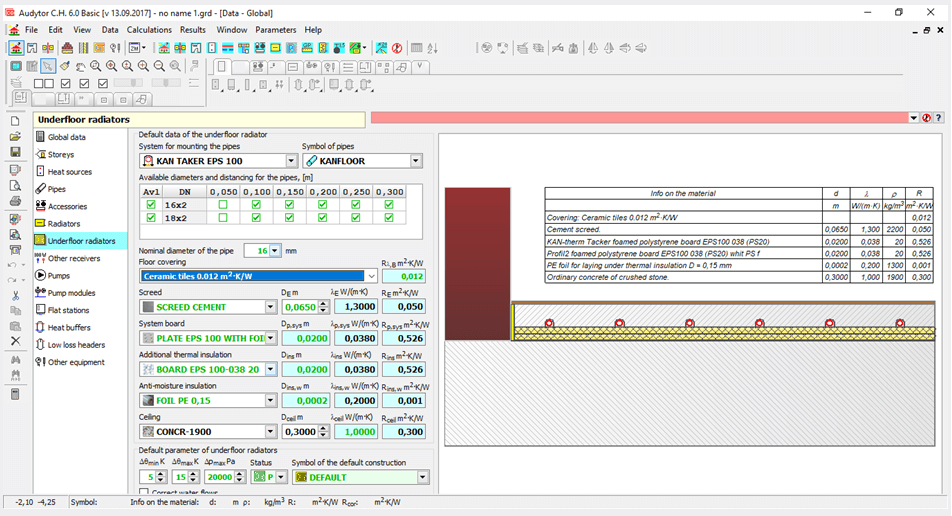
Before starting the design of the surface system, the user should declare the parameters related to the radiator's constrution. The constrution data will be automatically inherited directly into the drawning, significantly reducing the data entry time.
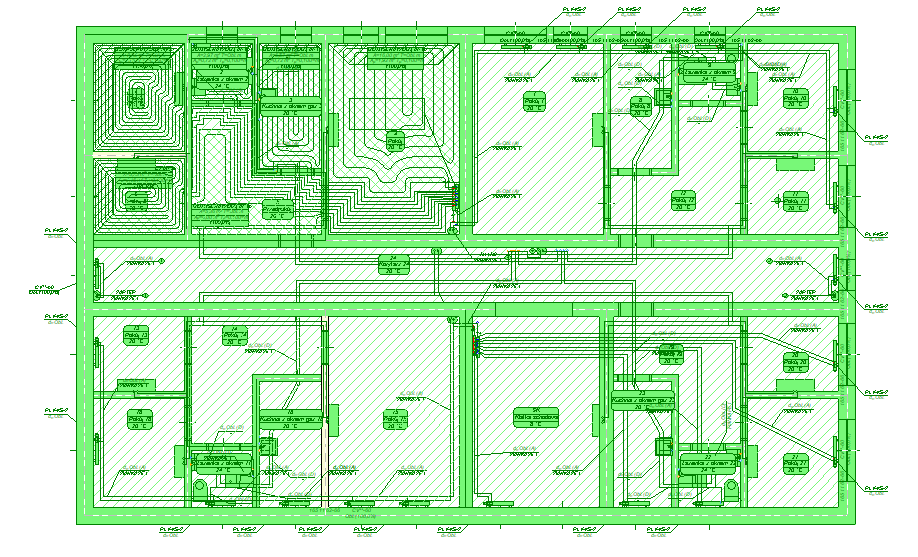
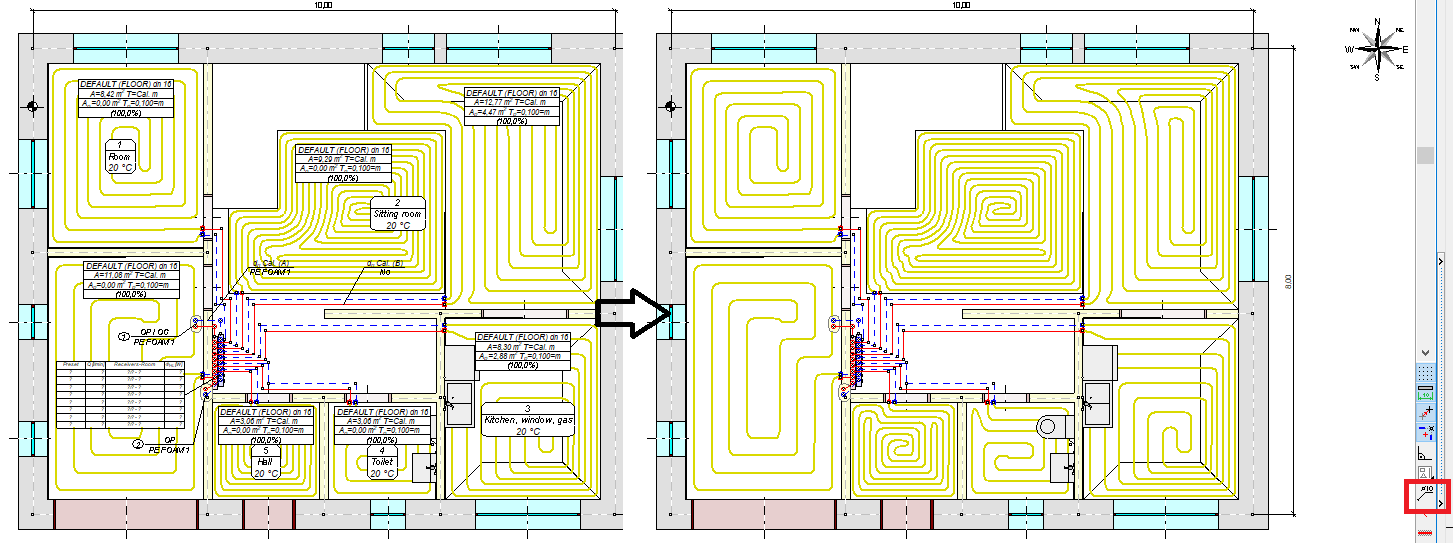
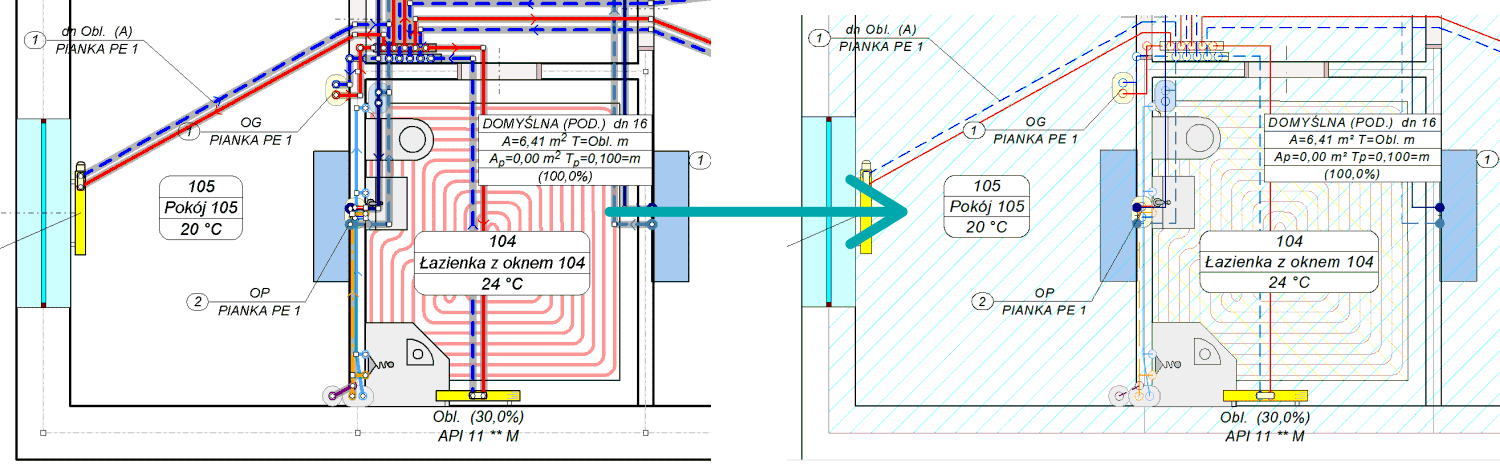
Calculations of the resulting cooling efficiency of the installation
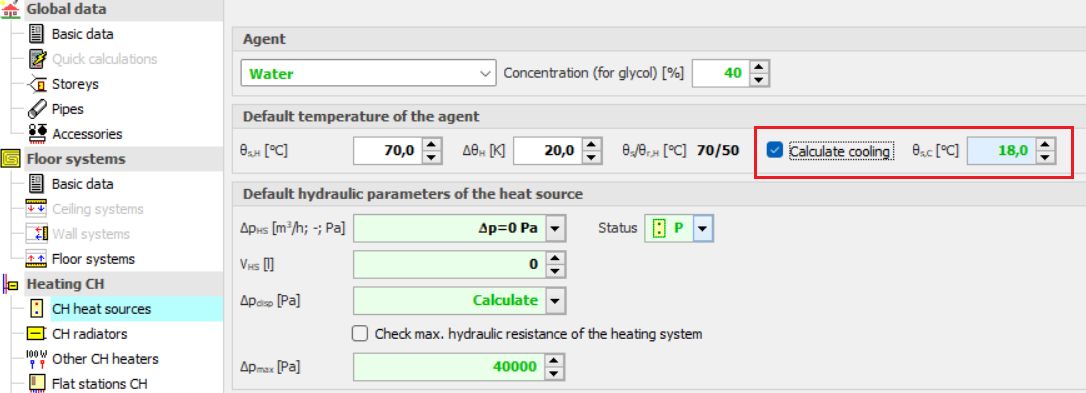
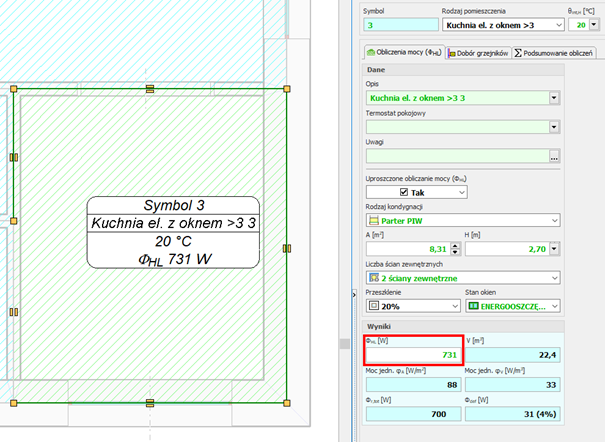
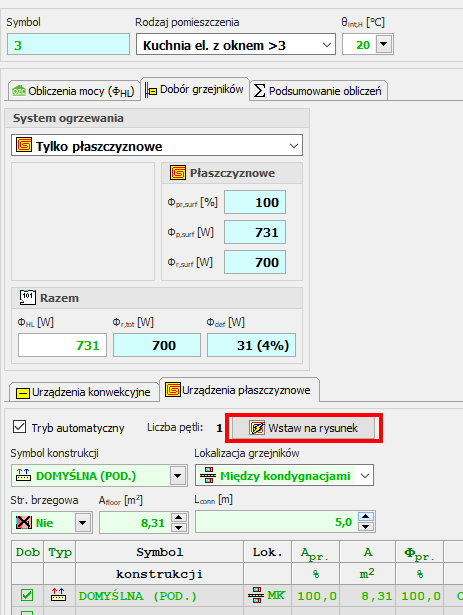
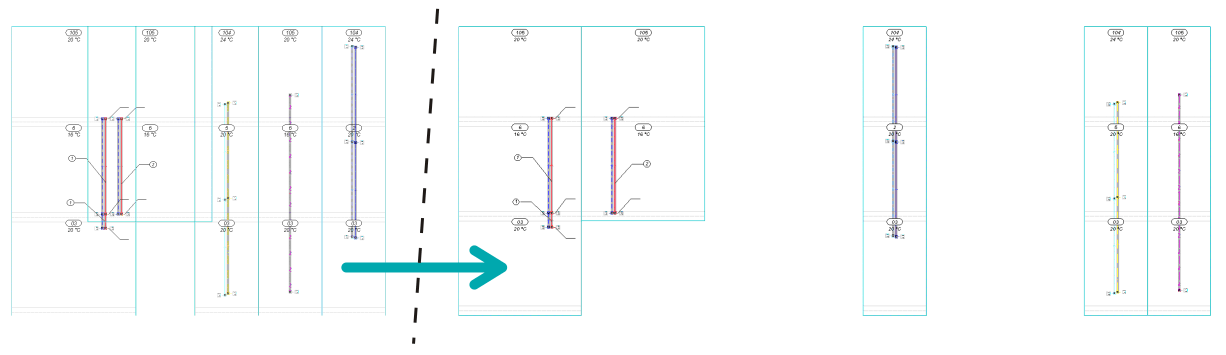
After designing the surface installation with heating parameters, the program will determine the resulting cooling power when switched to cooling mode.
These calculations will be performed if the CC module is activated in the general data and if in CH Heat Sorce Tab the Calculate Cooling option is enabled
The program uses the same flow rate of the agent in cooling mode as in the heating system. After performing the calculations, the results can be read both on the drawing – for example, on a tabular label attached to the manifold – and from the general tabular results.

Calculations of the resulting cooling efficiency of the installation
After designing the surface installation with heating parameters, the program will determine the resulting cooling power when switched to cooling mode.
These calculations will be performed if the CC module is activated in the general data and if in CH Heat Sorce Tab the Calculate Cooling option is enabled.
The program uses the same flow rate of the agent in cooling mode as in the heating system. After performing the calculations, the results can be read both on the drawing – for example, on a tabular label attached to the manifold – and from the general tabular results.
Audytor SET 7.3 - new possibilities!
The latest version of Auditor SET introduced new features and a number of improvements to speed up the installation design process.
The main changes are:
- New concept of work with SET program.
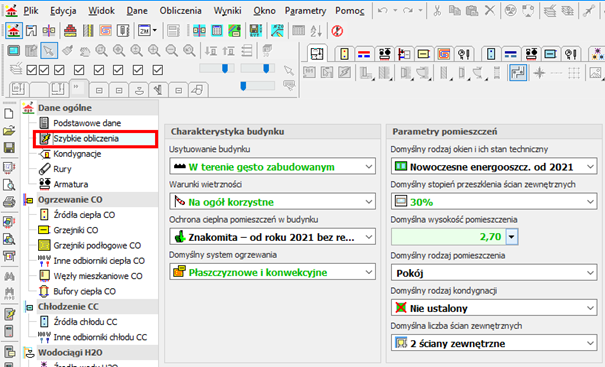
- New Fast Calculation (FC) module, which allows you to perform fast, approximate calculations of the thermal load of rooms and preliminary calculations of installations.
- Improvements in the design process of surface installations.
- Changed layout of the bill of materials.
- Changed module for viewing catalog data and selecting devices from catalogs.
- Improvements related to drawing wires.
- Improvements in graphics.
| HOW TO SWITCH TO 7.3 VERSION | GET MORE INFORMATION |
New concept of work with SET program
The new Fast Calculation (FC) module in the SET Auditor provides the opportunity for simplified installation design. It also makes it possible to speed up the creation of professional designs
In professional design mode, elements of simplified design can be used to streamline the design process (fast estimation of heat loss in the absence of results from the OZC program, selection of space heating concepts, etc.).
Both the simplified design and the detailed professional design are saved in the same file, which facilitates further work with the project.
Fast calculations of room thermal load
This function enables calculation of the value of room thermal load in a simplified manner based on a few basic parameters.
Thanks to this function, the designer can select the appropriate method of heating the room and get an idea of the type of heating equipment to be used in the room.
The surface layout suggested by the program can be inserted into the floor plan drawing.
Fast selection of elements without the need to draw the entire installation
When performing fast calculations, the program selects radiator power and duct diameters even if the heat source is not entered. From the default values declared in the general data, it inherits the parameters separately for the installation with radiators, separately for underfloor heating and places a virtual source in the resulting drawing.
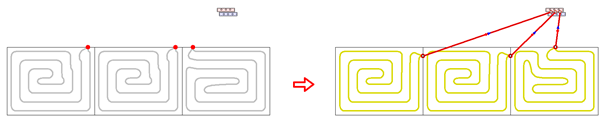
Automatic generation of simplified connection routes
After selecting the manifold and individual receivers, the program generates simplified connections automatically.
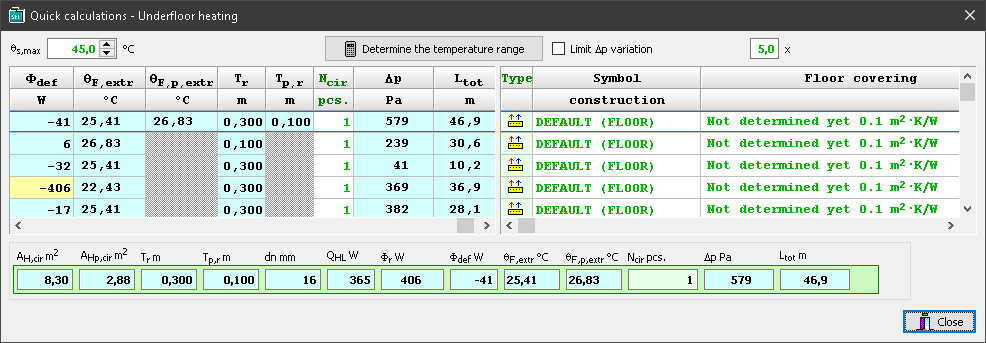
Function of quick calculation of underfloor radiators
This function makes it possible to perform calculations for a group of underfloor radiators during the design process, before the complete calculation of the installation. Thanks to this, it is possible to quickly test the response of the calculation results to individual data (e.g. supply temperature, heating floor structure, diameter of the pipes, spacing of pipes, division into several circuits, etc.).
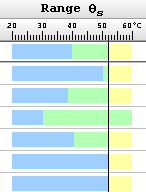
The function of quick selection of underfloor radiators allows to determine:
- possible supply temperature range for individual radiators
- maximum supply temperature for the indicated group of radiators
- proposed division of coils in order to meet the criteria of maximum hydraulic resistance and maximum length
- proposed division of coils in order to reduce the differences in resistance between coils and to facilitate hydraulic balancing of the installation.
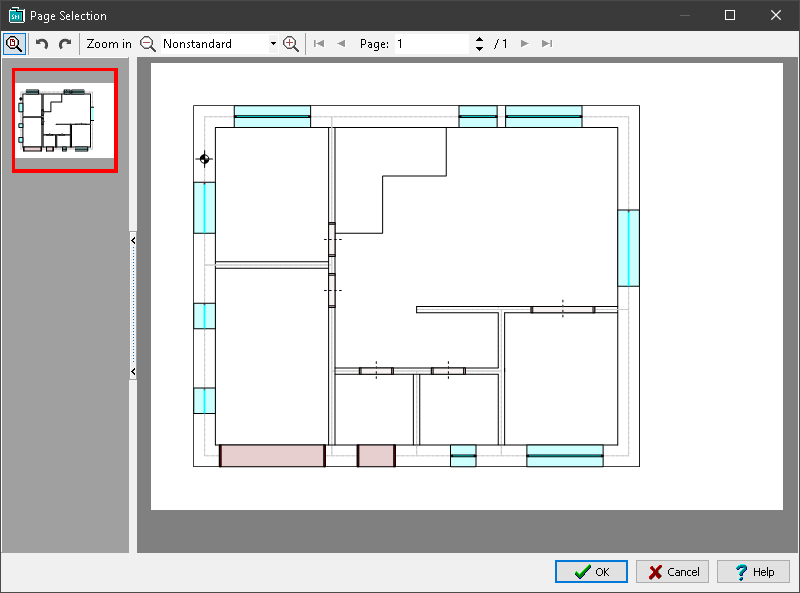
Import of building bases in PDF format
The Audytor program has long been able to import drawings in many popular formats. DWG and DXF formats are particularly suitable for technical drawings. However, in market practice, a large part of the documentation is provided in PDF files. Although it is a general format and not addressed to technical drawings, due to frequent use, the Audytor SET software has the option of importing drawings also in this format.
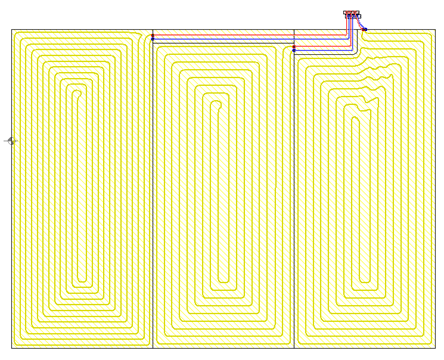
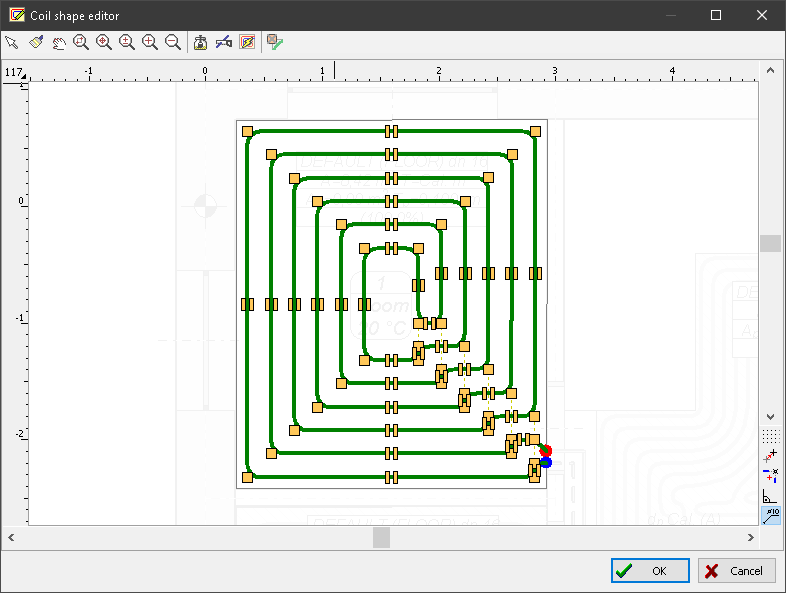
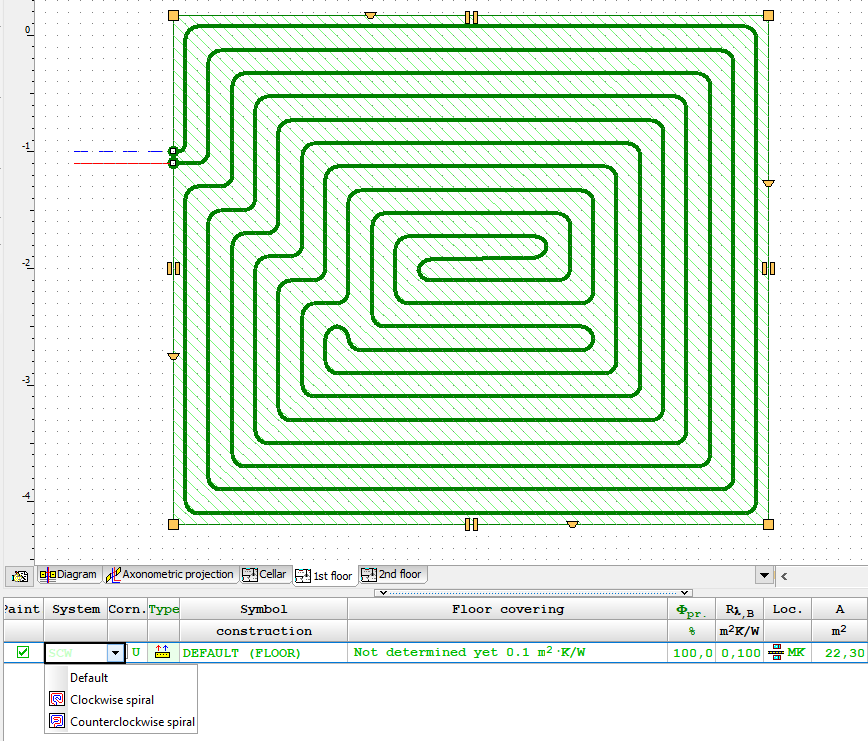
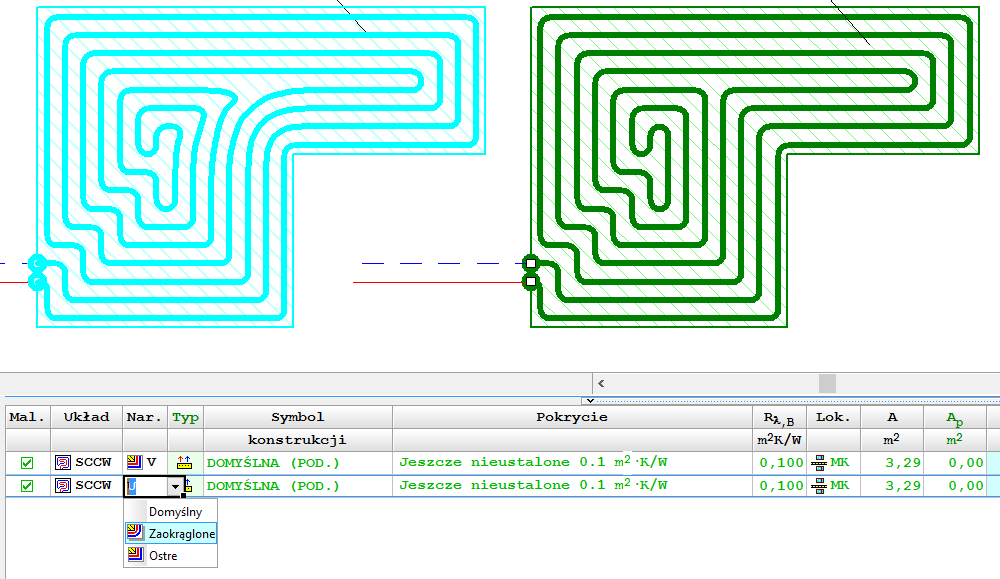
Drawing of underfloor heating coils
The program has expanded the possibilities of automatic drawing of floor heating coils. Currently, the user can choose one of the following ways to create a given coil:
- spiral with clockwise direction
- spiral with counter-clockwise direction
- meander coil.
Besides, the user can edit (correct) the coil shape created by the program.
New graphic design of the Audytor SET program
The graphic design has been changed in the program - both in terms of the graphic style and window organization. Thanks to this, they have become even more transparent

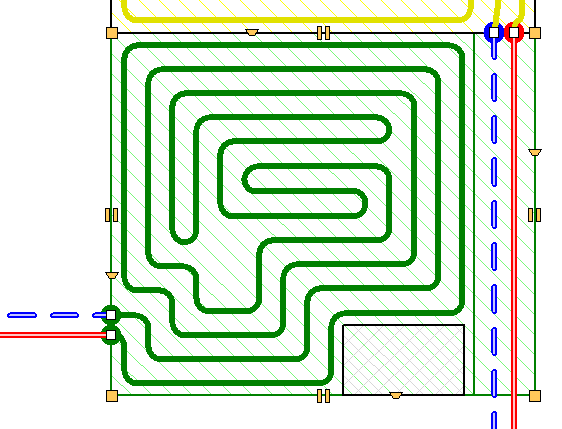
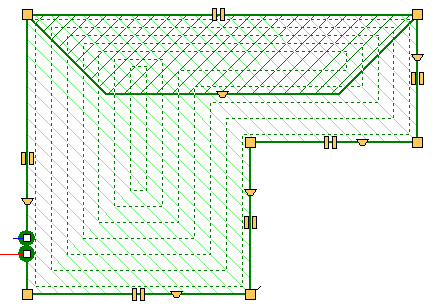
Mechanism for determining the effective heating surface of floor heaters
The automatic coil pipe generation mechanism has been extended with a function that allows determining the effective heating surface of a floor heater. The coil system can occupy the surface of the entire heater or "bypass" the manifold and connecting pipes of other heaters. It is also possible to designate zones to turn off part of the heating zone without having to change the shape of the heater itself.
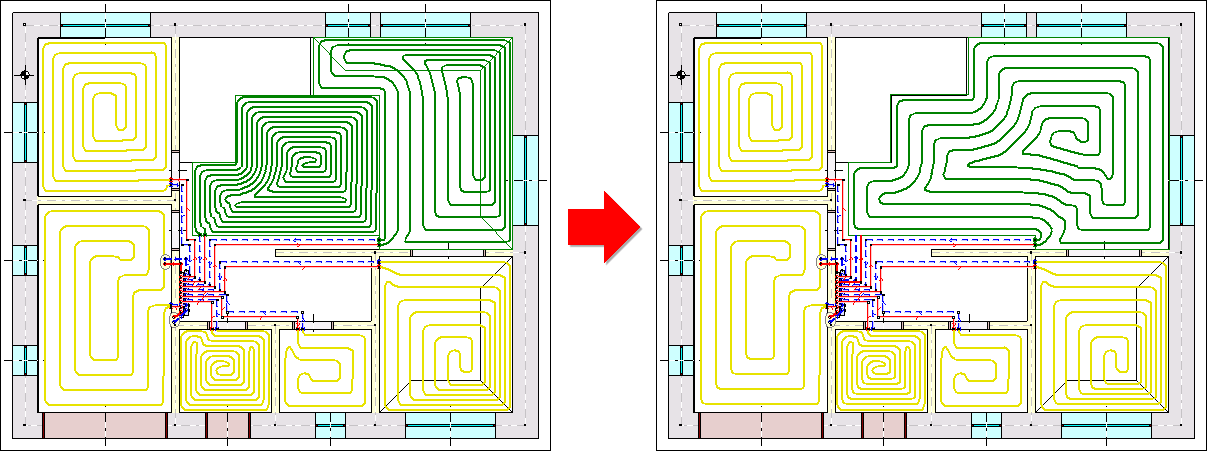
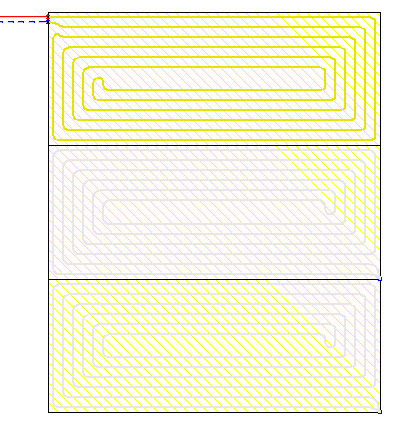
Dividing and joining heating zones, rooms and polygons
Tools for quickly dividing and connecting polygons that define hotplates. One field can be divided into two or three equal fields - horizontally or vertically, respectively. The user can also indicate a dividing line using a broken line. At the same time, the option of combining several cooking zones into one has been introduced.
These functions are especially useful when designing underfloor heating, but can be used for sharing
and joining other polygons (e.g. room zones).

Selection of coil drawing direction
The program allows you to choose the direction of drawing the spiral coil clockwise or counterclockwise.
Choice of pipe laying method in concave corners
Depending on the shape of the room and the assumed coil pipe laying system, it is possible to impose a way of drawing pipes "bypassing" concave corners.
Auxiliary lines for manual drawing of the coil
If the automatic coil generated option is switched off, the program displays auxiliary lines supporting manual drawing of lines. The lines are drawn with a given spacing taking into account the spacing in the peripheral zone.
Insert a heating zone around the cursor
The function of automatic insertion of a heating zone in the room zone (so-called insertion around the cursor).
Showing unconnected heating zones
The heating zones before connecting to the pipes are displayed in less intense colors, thanks to which it is very easy to know which fields still need to be connected.
Extending the range of mixing group schemes
Extended range of mixing group schemes with the possibility of local mixing at the manifold.
Drawing in drawing
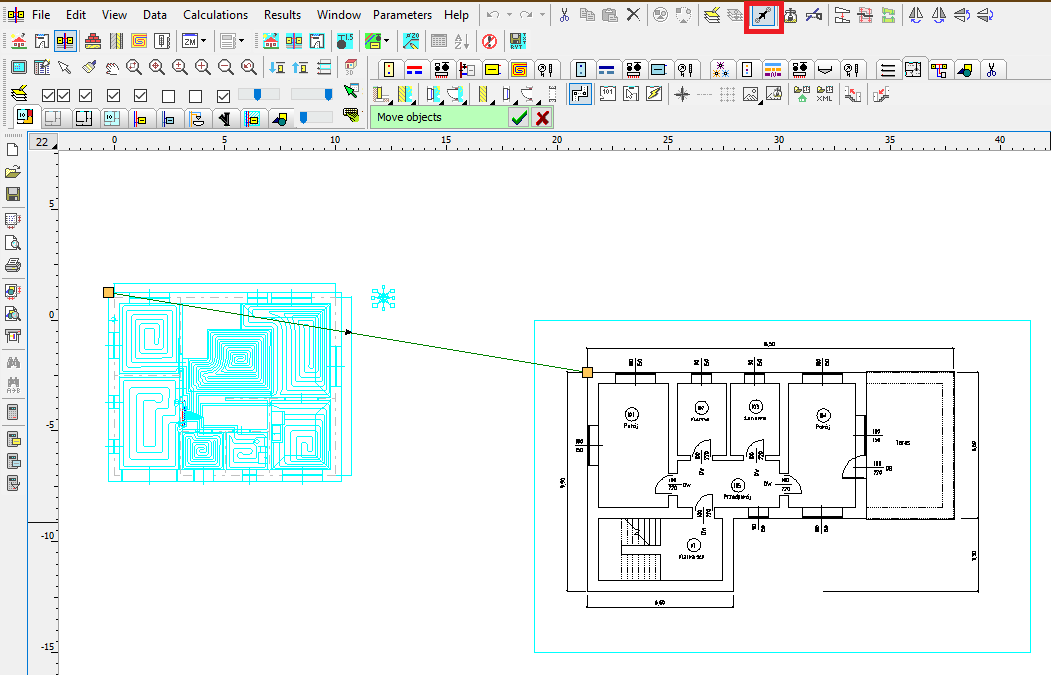
It is possible to insert a fragment of another drawing in the drawing. This significantly increases the possibility of creating clear technical documentation.
Inserting a fragment of a DWG drawing
The ability to easily use one DWG file containing architectural plans of many floors.
The user can indicate which parts of the DWG file are to be used on each floor and then adjust their position using precision panning tools.

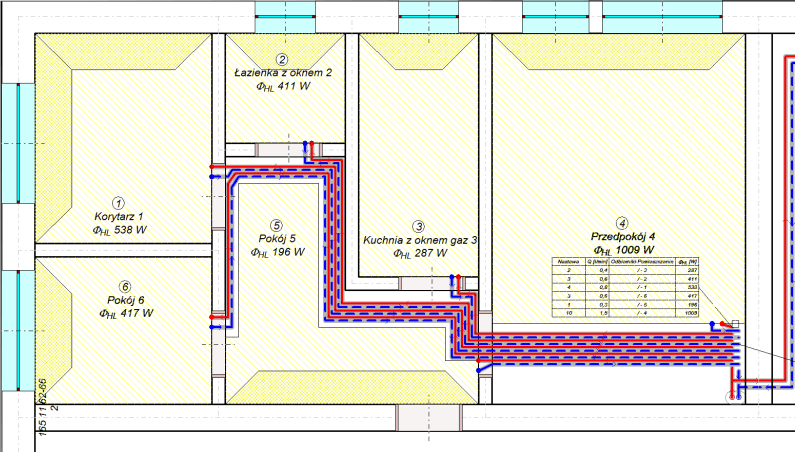
Coloring the walls
Display of walls with filling - gray for external walls and yellow for internal walls. This improves the readability of created drawings.
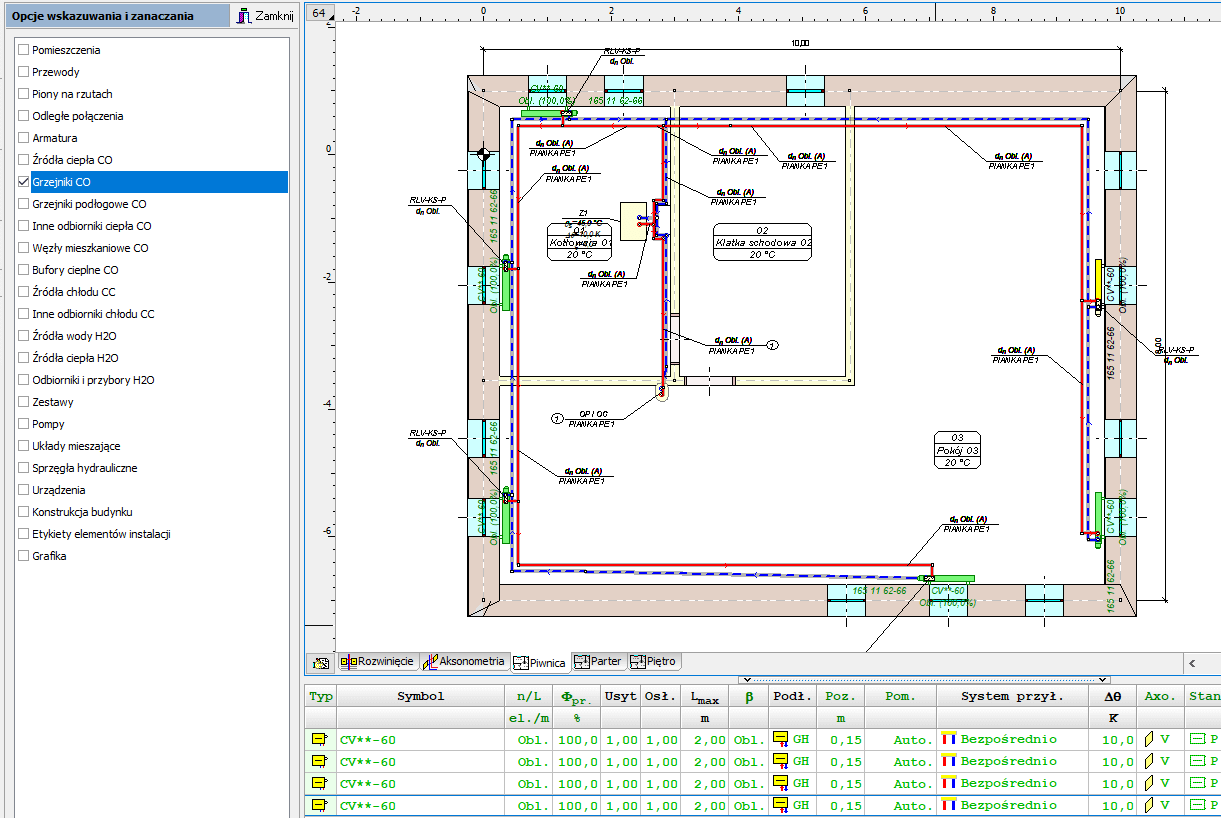
Selection in color
When selecting objects using the window, the selection window is filled with blue, which improves its readability.
Readability of selected objects has also been increased by displaying them with all details in green.
Selective selection
The selective selection function allows you to indicate what elements of the drawings are to be marked (e.g. rooms, pipes, fittings, etc.).
This function is useful when, for example, the user would like to duplicate selected elements from the indicated area to the next floor.
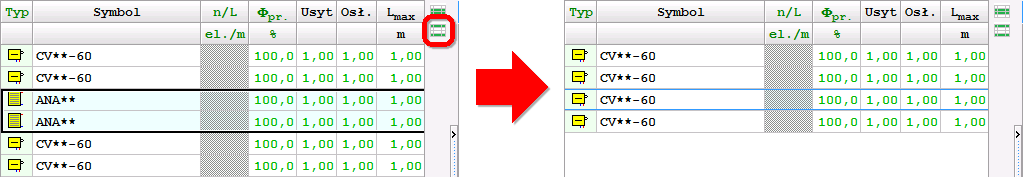
Narrow the range of selected objects in the tables
The functions Leave selected lines and Leave unselected lines allow you to narrow the range of selected objects. After selecting a number of elements in the drawing window, you can then remove from the selection the items indicated in the table or just leave those items.

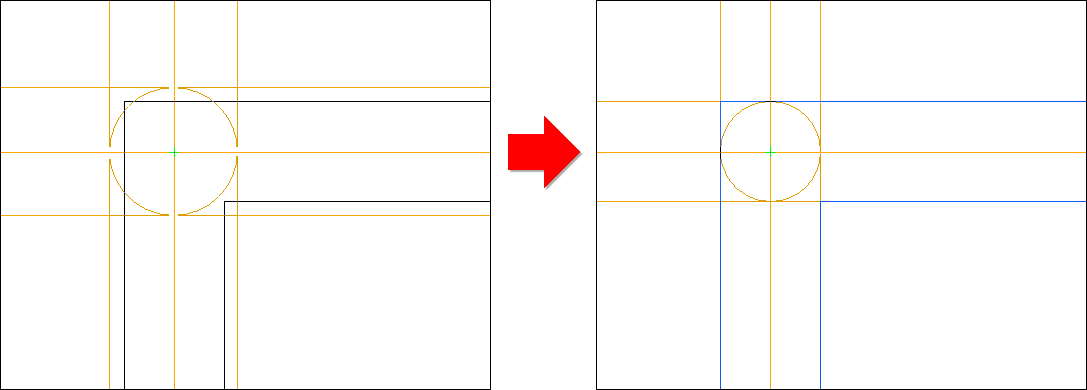
Precise moving of objects
This function enables precise moving of objects. The user defines the displacement vector, i.e. specifies the start and end points.
This function, combined with the Magnifier tool, enables very precise moving of objects. It is very useful, in the case of matching architectural objects on different floors. Just enable the display of the previous floor and then indicate the corresponding points on the architectural plans of two floors.
Improved critical flow display
When you turn on critical flow display, the other elements of the drawings are displayed less intensively. This makes it even easier to orient yourself in the course of critical circulation.

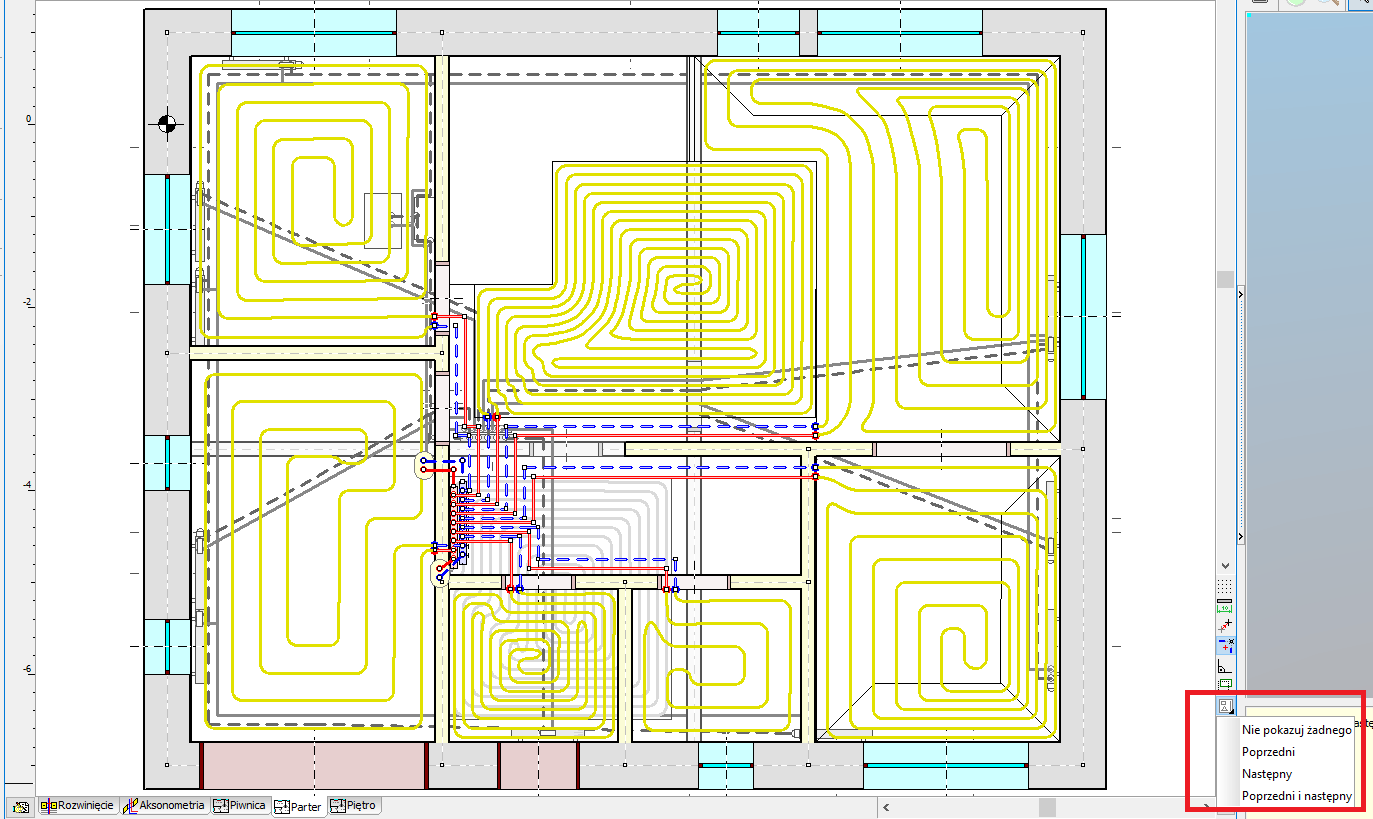
Drawing adjacent floors
Expanding the possibilities of displaying (drawing) the previous floor.
Currently, elements of the previous storey or the next storey can be displayed, or both. This facilitates adjusting architectural projection positions and location of installation risers.
Temporarily turn off of the label display
The option of temporarily turning off the display of labels during design, improves the readability of drawings on the screen in situations where labels are not necessary.
Adjusting wall thickness
This option allows you to change the thickness of the walls when drawing them:
– CTRL + left square bracket - reducing the wall thickness,
– CTRL + right square bracket - increasing wall thickness.
The same effect can be achieved by pressing the CTRL key while holding the mouse wheel. This function allows easy adjustment of the wall thickness to the loaded building foundation (planview).
Export extension to Excel
The ability to export to Microsoft Excel not only individual tables, but also all tables and diagnostics at once. This significantly reduces exporting time if you need to save a number of tables.
Import and export of drawings in DWG format
The program has been equipped with the latest cooperation module with DWG and DXF files.
It allows among others:
- Loading DXF and DWG drawings in the newest versions.
- UNICODE text support for most characters to be displayed correctly.
- Export of drawings in the following formats: DWG, DXF, PDF, SVG, CGM, HPHL, SWF.
- Significantly faster display of complex drawings thanks to the simplified paint function.
- A more realistic export of drawings to DXF and DWG files.
- Saving raster drawings in DXF and DWG files.
- More convenient management of drawing layers

Import of building bases from Autodesk® Revit®
The function allows to create layout of corresponding to the levels on which rooms have been defined in Autodesk® Revit®. The transfer of data takes place via a file generated in Autodesk® Revit® using the Audytor gbXML plugin.

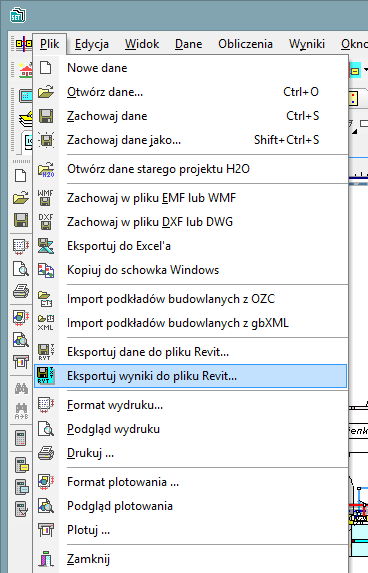
Export of the installation project to Autodesk® Revit®
The function allows you to export the installation project to a file that can later be loaded into Autodesk® Revit® using the Audytor SET plugin for Revit.
The function allows you to export from the data and export from the results. Export from data allows you to save even an incomplete installation project (not recalculating), for example, the arrangement of the water risers, or the layout of the radiators. Export from results allows us to use technical data of selected pipes and devices in Autodesk® Revit®, eg pipe diameters, valve settings, radiator sizes, and pipe spacing in underfloor heating. In addition, physical quantities are available, such as the medium speed, the power of the radiator, and pressure losses.
| 7.3 Pro | 7.3 Basic | 7.2 Pro | 7.2 Basic | 7.1 Pro | 7.1 Basic | 365 Pro | 365 Basic | |
|---|---|---|---|---|---|---|---|---|
| Calculations of the resulting cooling efficiency of the installation |

|
|
||||||
| Calculations of the resulting cooling efficiency of the installation |
|
|
||||||
| New concept of work with SET program |
|
|
|
|
||||
| Fast calculations of room thermal load |
|
|
|
|
||||
| Fast selection of elements without the need to draw the entire installation |
|
|
|
|
||||
| Automatic generation of simplified connection routes |
|
|
|
|
||||
| Function of quick calculation of underfloor radiators |
|
|
|
|
|
|
||
| Import of building bases in PDF format |
|
|
|
|
|
|
||
| Drawing of underfloor heating coils |
|
|
|
|
|
|
||
| New graphic design of the Audytor SET program |
|
|
|
|
|
|
||
| Mechanism for determining the effective heating surface of floor heaters |
|
|
|
|
|
|
||
| Dividing and joining heating zones, rooms and polygons |
|
|
|
|
|
|
||
| Selection of coil drawing direction |
|
|
|
|
|
|
||
| Choice of pipe laying method in concave corners |
|
|
|
|
|
|
||
| Auxiliary lines for manual drawing of the coil |
|
|
|
|
|
|
||
| Insert a heating zone around the cursor |
|
|
|
|
|
|
||
| Showing unconnected heating zones |
|
|
|
|
|
|
||
| Extending the range of mixing group schemes |
|
|
|
|
|
|
||
| Drawing in drawing |
|
|
|
|
|
|
||
| Inserting a fragment of a DWG drawing |
|
|
|
|
|
|
||
| Coloring the walls |
|
|
|
|
|
|
||
| Selection in color |
|
|
|
|
|
|
||
| Selective selection |
|
|
|
|
|
|
||
| Narrow the range of selected objects in the tables |
|
|
|
|
|
|
||
| Precise moving of objects |
|
|
|
|
|
|
||
| Improved critical flow display |
|
|
|
|
|
|
||
| Drawing adjacent floors |
|
|
|
|
|
|
||
| Temporarily turn off of the label display |
|
|
|
|
|
|
||
| Adjusting wall thickness |
|
|
|
|
|
|
||
| Export extension to Excel |
|
|
|
|
|
|
||
| Display of system pipes with actual diameters |
|
|
|
|
|
|
|
|
| Intelligent duplication of system components - "down". |
|
|
|
|
|
|
|
|
| A system of editable keyboard shortcuts |
|
|
|
|
|
|
|
|
| The function of organizing labels on several floors at the same time |
|
|
|
|
|
|
|
|
| Import and export of drawings in DWG format |
|
|
|
|
|
|
|
|
| Import of building bases from Autodesk® Revit® |
|
|
|
|
||||
| Export of the installation project to Autodesk® Revit® |
|
|
|
|
||||
| The ability to check the correctness of the floors layout |
|
|
|
|
|
|
|
|
| Creating a list of fittings |
|
|
|
|
|
|
|
|
| Adjustment of existing installations |
|
|
|
|
|
|
|
|
| Designing new installations |
|
|
|
|
|
|
|
|
| Designing a traditional two-pipe installation |
|
|
|
|
|
|
|
|
| Desiging on plan views |
|
|
|
|
|
|
|
|
| Desiging on diagrams |
|
|
|
|
|
|
|
|
| Loading of building bases with the results of heat load from the Audytor HL program |
|
|
|
|
|
|
|
|
| Loading the list of rooms with the results of the heat load from the Audytor HL software |
|
|
|
|
|
|
|
|
| The ability to draw building bases (walls, windows and doors) |
|
|
|
|
|
|
|
|
| Automatic creation of diagrams of risers based on plan views |
|
|
|
|
|
|
|
|
| Visualization of critical circuits |
|
|
|
|
|
|
|
|
| Auxiliary lines indicating characteristic points |
|
|
|
|
|
|
|
|
| Drawing lines in pairs (supply - return) |
|
|
|
|
|
|
|
|
| Drawing lines with a continuous broken line |
|
|
|
|
|
|
|
|
| Automatic inserting of radiators under the windows |
|
|
|
|
|
|
|
|
| Automatic connection of radiators to distribution pipes |
|
|
|
|
|
|
|
|
| Bonding and scaling drawings |
|
|
|
|
|
|
|
|
| Graphical editor |
|
|
|
|
|
|
|
|
| Duplicating fragments of drawings within a storey and to the next storeys |
|
|
|
|
|
|
|
|
| The system default data inheritance |
|
|
|
|
|
|
|
|
| Creating mirror images of parts of drawings |
|
|
|
|
|
|
|
|
| Working in a shared environment Audytor SET |
|
|
|
|
|
|
|
|
| Ready-made blocks of typical parts of the installation |
|
|
|
|
|
|
|
|
| Backup system of data files |
|
|
|
|
|
|
|
|
| Ability to create your own blocks |
|
|
|
|
|
|
|
|
| Extensive directory database |
|
|
|
|
|
|
|
|
| Extended editing functions in tables |
|
|
|
|
|
|
|
|
| "Find and Replace" function in tables |
|
|
|
|
|
|
|
|
| Designing of underfloor radiators |
|
|
|
|
|
|
|
|
| Automatic drawing of the underfloor heating coil |
|
|
|
|
|
|
|
|
| Data diagnostic system |
|
|
|
|
|
|
|
|
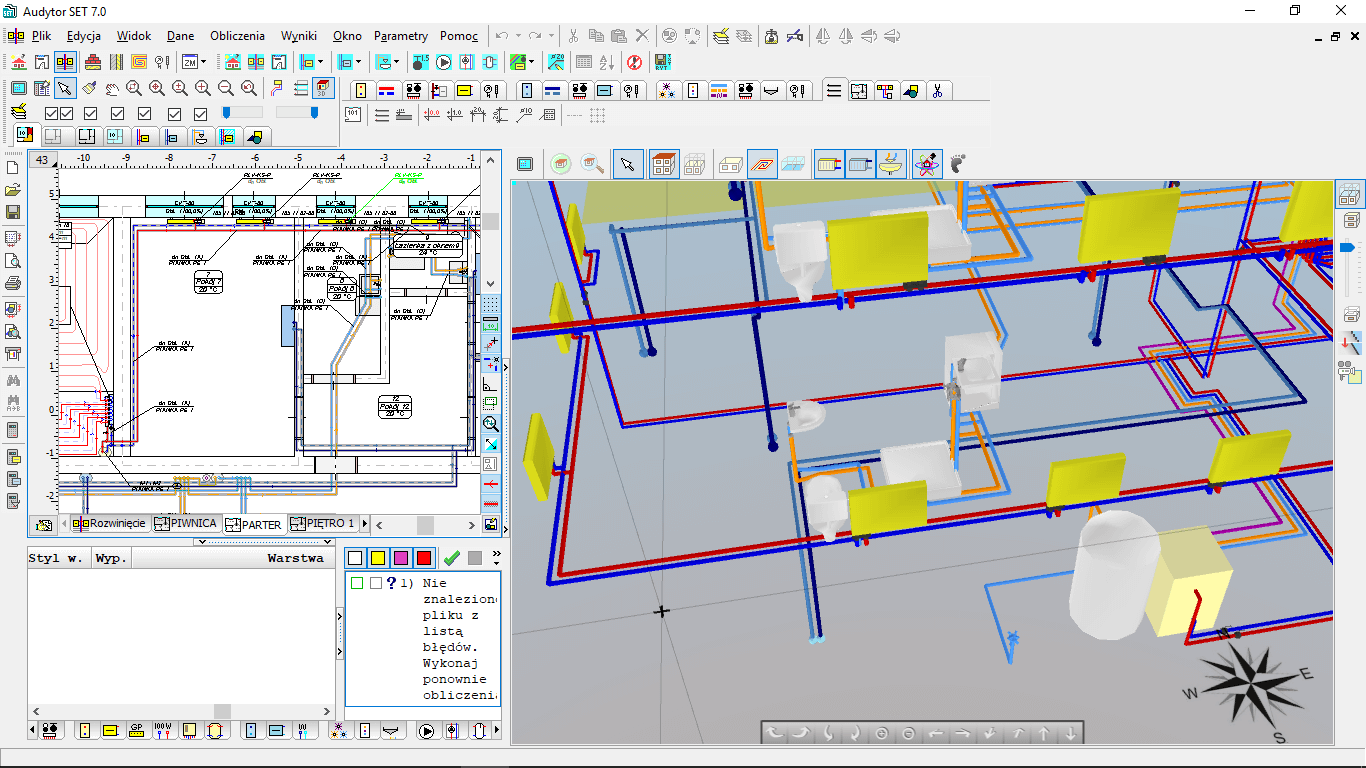
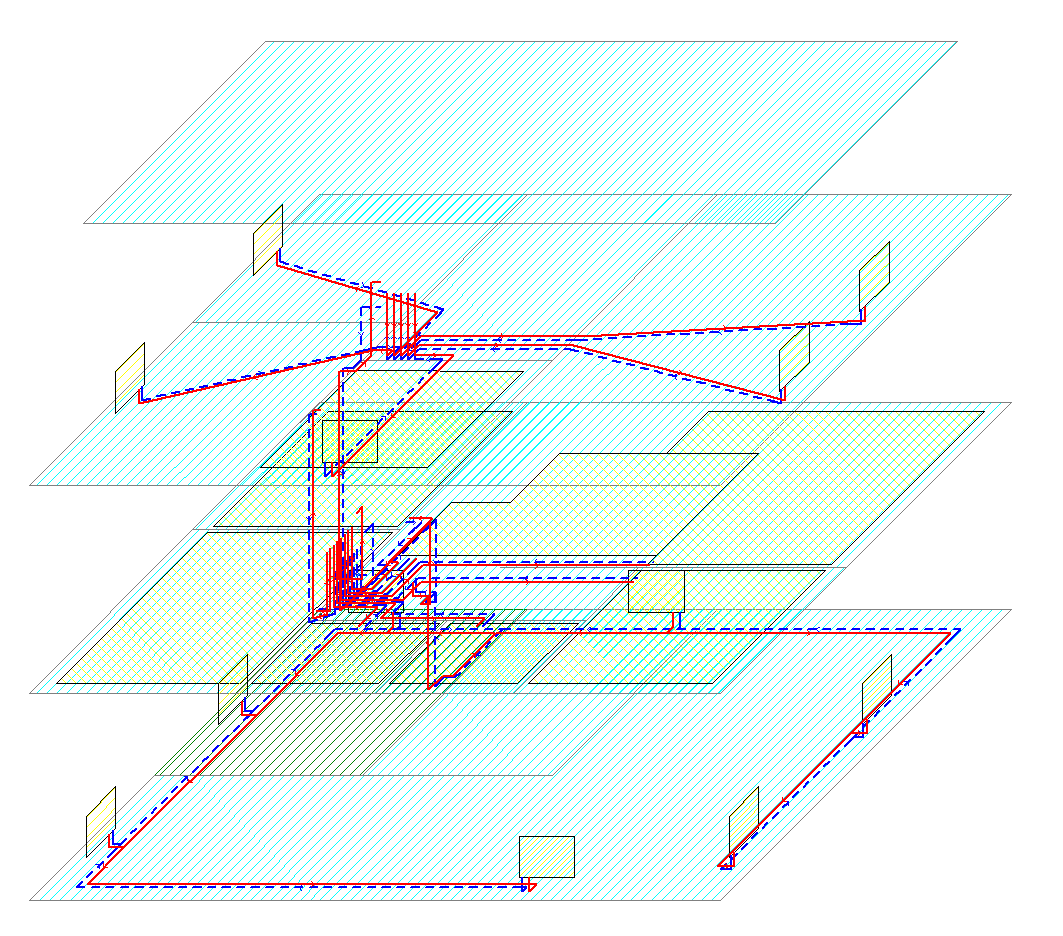
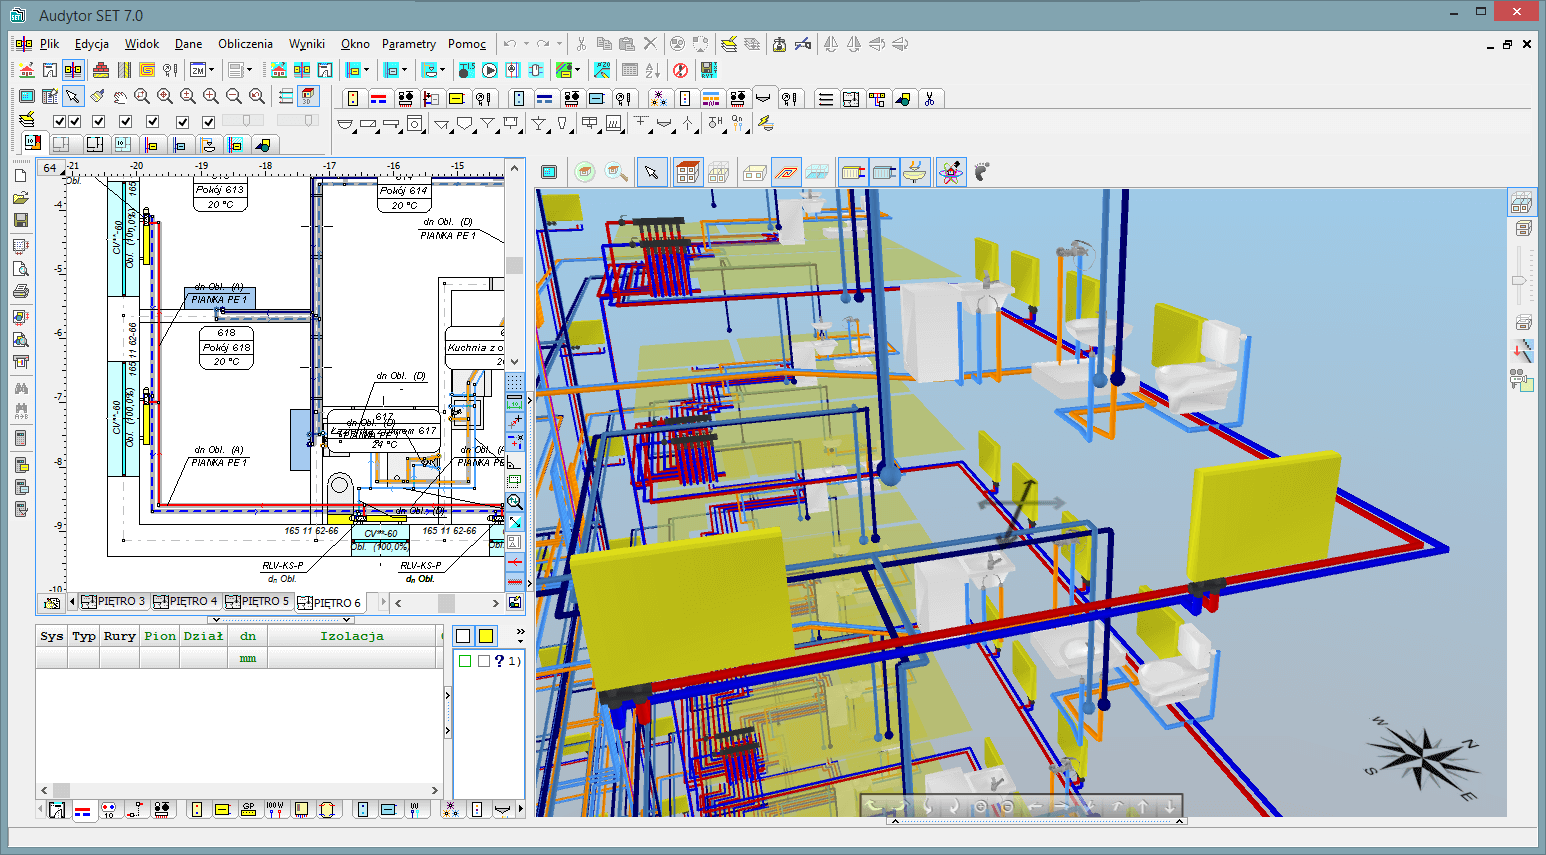
| Three-dimensional visualization of the installation |
|
|
|
|
|
|
|
|
| Extended error diagnostics |
|
|
|
|
|
|
|
|
| Automatic axonometry of the installation |
|
|
|
|
|
|
|
|
| Defining default data for all kinds of devices |
|
|
|
|
|
|
|
|
| Catalog photos of selected devices in the hints in the table |
|
|
|
|
|
|
|
|
| The function of organizing zones of risers on the diagrams |
|
|
|
|
|
|
|
|
| Considering the heat gains from connections to underfloor radiators as a radiator power |
|
|
|
|
|
|
|
|
| Selection of pipe diameters in the installation |
|
|
|
|
|
|
|
|
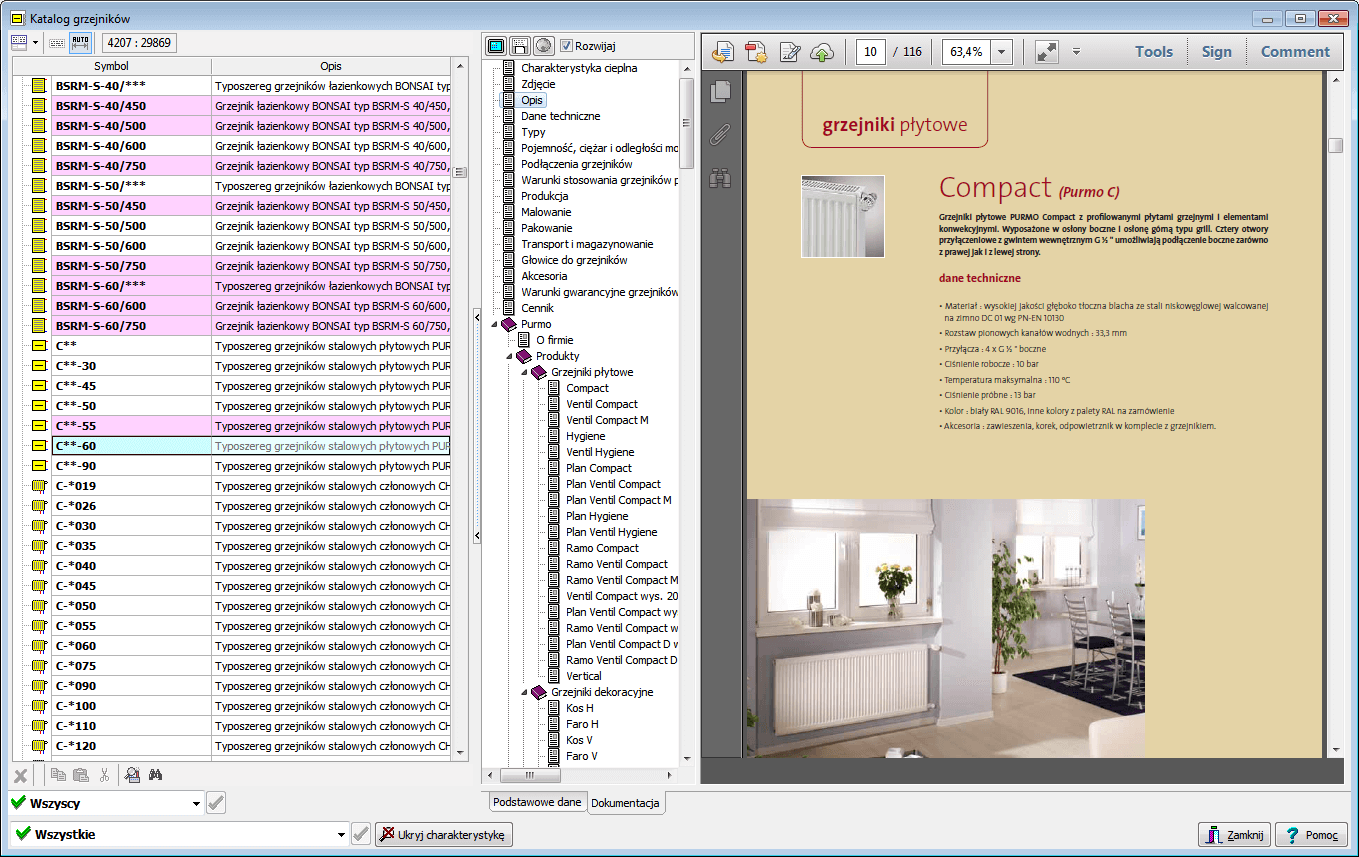
| Selecting radiators (catalog 55 thousand) |
|
|
|
|
|
|
|
|
| Selecting fittings |
|
|
|
|
|
|
|
|
| Provides total pressure losses in the system |
|
|
|
|
|
|
|
|
| Reduces excess of pressure in the circuits through the selection of presets on the valves or flanges selection of the throttle bores. |
|
|
|
|
|
|
|
|
| Adjusts presets of the pressure and flow rate governors |
|
|
|
|
|
|
|
|
| Takes into account the requirements regarding the authorities of thermostatic valves |
|
|
|
|
|
|
|
|
| Selects group of pumps |
|
|
|
|
|
|
|
|
| Selects pumps |
|
|
|
|
|
|
|
|
| Allows the use of dual manifolds |
|
|
|
|
|
|
|
|
New program features
- Possibility to import building bases from Autodesk® Revit® via a gbXML file,
- Possibility to export data about the designed installation to Autodesk® Revit®..
New program features Audytor
- Import and export of drawings in DWG format
- The function of organizing the zones of risers in the development
- Data file backup system
- A mechanism that automatically generates an axonometric scheme of the designed installation
- Ability to display installation pipes with actual diameters
- Mechanism of intelligent duplication of installation elements
- The function of arranging labels on several storeys at the same time (in plan views and axonometry drawings) and a mechanism for duplicating labels on adjacent storeys
- Improving the drawing of sewage installations.
- A system of keyboard shortcuts to assign simple button combinations to the most used drawing tools.
- Improvements in editing drawing layer properties.
- Improvements in displaying information about the circulation by a given heater / receiver.
Characteristics of the program
The program allows performing a full hydraulic calculations of a system, under which:
- Selects pipe diameters.
- Determines the hydraulic resistance of individual circuits, taking into account the gravity pressure resulting from cooling of water in pipes and heat receivers.
- Provides total pressure losses in the system.
- Reduces excess of pressure in the circuits through the selection of presets on the valves or flanges selection of the throttle bores. It takes into account the need to ensure adequate hydraulic resistance of pipe-run.
- Selects presets on differential pressure controllers installed in locations selected by the designer (the base of a riser, branch of the system etc.).
- Automatically takes into account the requirements of authority of thermostatic valves (suitable pressure drops on valves).
- Selects flat station (version 3.8).
- Selects buffers cooperating with flat stations (version 3.8).
- Selects pump group.
- Selects pumps.
- Allows the use of hydraulic couplings.
- Allows use of dual manifolds.
The program allows performing thermal calculations within which:
- Defines the heat gains from the pipes.
- Calculates cooling of the heating agent in the pipes.
- For a given heat load determines the required size of radiators.
- Selects appropriate heating agent flows taking into account its cooling in pipes and heat gains from pipes (a variant of an existing installation regulation, e.g. in insulated buildings).
- Considers the effect of cooling of water in the pipes on gravitational pressure value s well as on thermal output of the heat receivers.
- Calculates parameters of the designed underfloor radiators.
In the program it is possible to design the following systems:
- Pump system.
- Layout of pipes: one-pipe, two-pipe, four-pipe or mixed.
- Heating or cooling agent: water, ethylene glycol or propylene glycol.
- Top distribution, bottom distribution, horizontal systems, manifold systems.
- Convection radiators, floor radiators, wall radiators.
- Automatic air bleeder valves (system cannot have a network bleed).
- Thermostatic or manual radiator valves.
- Initial balancing of the system using valves with presets or flanges.
- Stabilization of the differential pressure with differential pressure controllers.
- Possibility of application of flow controllers.
Catalogue database contains information about pipes, valves and heaters. Fittings, pipes and radiators of different companies can be used simultaneously in one project. The program enables designing very large systems (approximately up to 140 risers and 12,000 radiators).
Delivered with the software, library of standard parts of a drawing (blocks) such as typical parts of vertical or manifold systems, allows to create quickly the diagram of the system. In addition, you the user can define a virtually unlimited number of own blocks consisting of any parts of the drawing. Such blocks can then be used in subsequent projects. Using duplication function, the diagram of one storey can be prepared and copied automatically to subsequent storeys.
Data entry
Data can be entered to the program graphically on plan views or diagrams. The necessary information about the drawn elements are introduced into the tables associated with the plan views or diagrams. As a result of table approach, it is possible to edit quickly data related to single pipes, radiators, fittings, as well as whole selected groups of elements. Each component of the system is equipped with the validation and support system that allows to obtain information about the quantity being inputted or the relevant catalogue data.
In order to facilitate data entry, the software includes:
- The ability to edit simultaneously many system components.
- The possibility of using ready-made blocks.
- Intelligent functions duplicating any parts of a drawing horizontally and vertically, together with the appropriate renumbering of elements.
- Possibility to define an unlimited number of custom blocks consisting of any parts of the drawing.
- Quick access to auxiliary information on the quantities being inputted.
- The pop-up buttons facilitating access to frequently used components.
- Function dynamically linking data from a drawing with the data in the table.
- Functions connecting automatically fittings, radiators and other system components by pipes.
- Automatic creation of the risers on the basis of plan views.
- Editing data in tabular form giving the possibility of setting of parameters of multiple selected items at the same time.
- Dynamic linkage between the drawing data table highlights in the drawing, the element being edited in the table.
Data diagnostic system
-
Each inputted component is equipped with the validation and support system that allows to obtain information about the values or evokes the relevant catalogue, as well as test of data.
-
While entering data the program checks its correctness on an ongoing basis. This allows a significant reduction in the number of errors. During the calculation process, complete data validation takes place. As the result of that the list of errors, warnings and hints is created. The list includes the information about the significance levels and the place of the problems.
-
After the calculations, program analyses the obtained results. The analogue list of messages is created. Extensive system diagnostics enables the designer to fully assess the quality of the design. The program is equipped with a mechanism for quick search of where the error occurred (automatic finding a table, a row and a column with wrong data and faulty component is indicated in the drawing).
Building underlays
The program enables creation of the complete graphic documentation of the system design, thanks to the possibility of displaying the calculations results on the storey plan views. It is often required to enter the picture of the project under design. Pictures can be entered by reading pictures from a file, scanning or pasting from clipboard. After being entered, pictures frequently require levelling, calibrating, cropping and additional correction.
Technical drawings (eg. underlays) are now as a default created using computers. They are then available in the electronic format as files. Vector formats (eg. DWG, DXF, WMF, EMF) are the most suitable for technical drawings. Picture files can also be created as scans, then they are almost always available in the raster format (BMP, JPG, JPEG, TIF, TIFF, GIF, ICO, PNG).
Usually, while loading the picture, it will be necessary to complete information from the dialogue Picture units. After the picture has been inserted into the program it is usually necessary to perform its levelling and cropping, also the calibration might prove necessary to adjust the picture to its electronic equivalent. It is possible to choose the resolution and quality of the scan and to save scanned documents in a selected graphical format. The program is equipped with scanners compatible with the TWAIN specification.
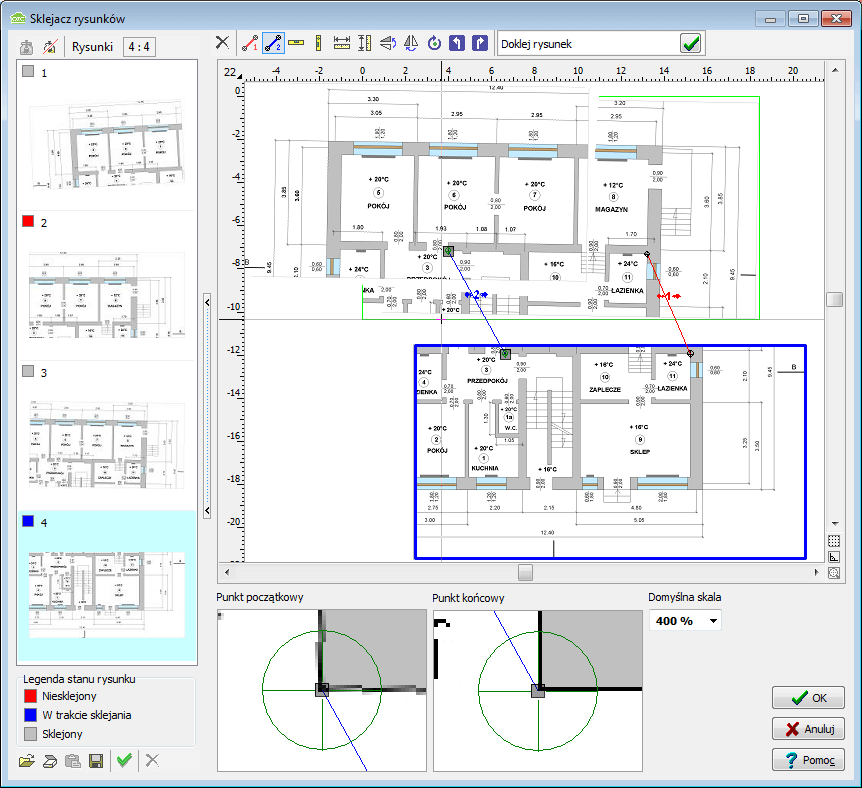
Bonding and scaling drawings
HL programs and CH are equipped with the function of Graphic creation of a building model. This function gives you the opportunity to draw a building model. To simplify the action of drawing, you can load a drawing base into the program. The file being loaded can come from an external program for creating technical drawings (eg DWG), or from a scanned drawing (eg JPG). The scanned drawing can be divided into several files. Drawings scanned into several files usually do not keep the scale precisely enough. They can also be rotated relative to each other by a small number of degrees.
Drawing bonding allows you to quickly scale multiple scanned drawings (in different sizes and rotated) and bond them with one another.
Graphical editor
Drawing with marked room zones is necessary to create the design of the system. The designer can draw the room zones manually or load them together with the plan views form heat load program. If in the HL program the three-dimensional model of the building was created, the plan views together with heat load results will be imported to SET program. The building entered in tabular form will be loaded as a list of rooms with the results.
The most comfortable mode of work using the full potential of cooperation between programs HL and SET:
- Loading building plan views from files such as DWG, DXF, WMF etc. to HL program.
- Drawing in HL program a 3D model of the building and running the thermal calculations.
- Loading results from HL program into SET program (heat load and floor plan views).
- Drawing the system in software installation HL program and performing calculations.
Design of the system can be done in the diagram, in plan views and partly in the diagram and partly in plan views.
In the case of drawing the system in plan views the program automatically creates a simple diagram “connecting” plan views.
In the case of drawing onplan views, the program automatically creates a simple diagram of risers, "fastening" individual projections. The program (Audytor CH, Audytor CC and Audytor H2O) has been equipped with a three-dimensional visualization module of the installation, analogous to the building visualization module, available in the Audytor HL program.

The system default data inheritance
A significant part of the parameters entered at the beginning of the building defining is data typical for the whole building (i.e. the default data). This data is used by the system of data inheritance.
The user can define for each class of device among others default catalogue symbol. The symbol is automatically assigned (inherited) to each device placed in the design. The default catalogue symbol can be changed at any time, even after inserting devices to the drawing. Change of the symbol in global data will change the symbols of all devices of that type, unless for a given element was another symbol was entered individually. Many other parameters may be inherited in the analogue way.
The data is edited in the table which allows the simultaneous determination of parameters for multiple elements. Linkage between the drawing and the table highlights in the drawing the element edited in the table.
Data inheritance system allows you to:
- significant time savings on data entry stage (eliminates the need for entering of repetitive data many times)
- very quick change of repetitive data in case of changes of design assumptions or preparing variant designs.
Working in a shared environment Audytor SET
The program (since version 7.0) has been created as a module of the Audytor SET program and enables the simultaneous design of cooling, cold and hot water systems together with circulation and central heating installations. Individual modules of the program cooperate with each other and use a common 2D and 3D graphic environment.
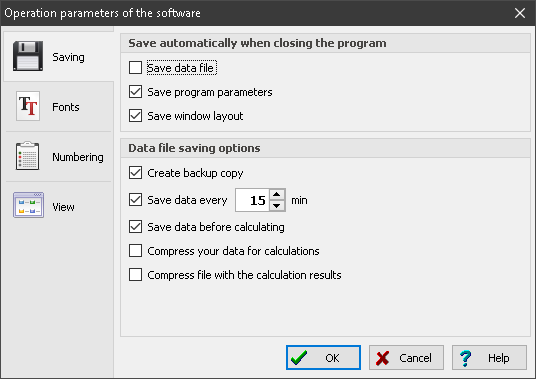
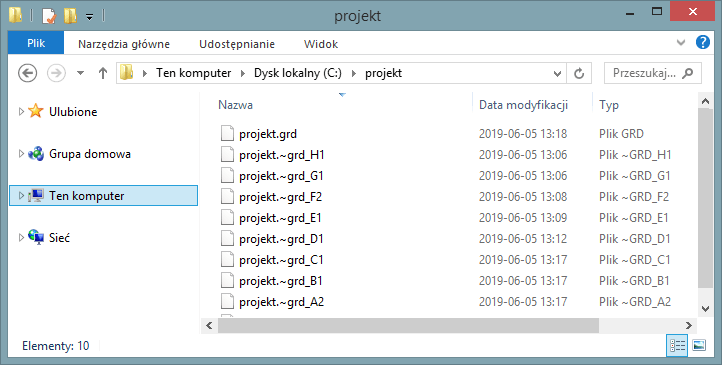
Backup system of data files
The program has a mechanism that automatically creates a set of project backups (up to 8 files).
Data files are backed up every time data is saved, with the new files overwriting the older files so that at least one copy of the file from each stage of the project work is always kept.
This function will allow you to recover the project file even if its last versions are overwritten or damaged.
Extensive directory database
The program catalog database contains information on pipes, fittings and radiators. This database is constantly developed.
In one design, fittings, pipes and radiators from different companies can be used simultaneously.
Drawing support functions
- The mouse cursor takes the shape of a small image of adequate to the currently used function.
- Auxiliary lines are displayed suggesting an automatic connection to specific characteristic points (e.g. radiator connection points).
- Pipes can be drawn as pairs (supply/return) with a selected spacing, which, if necessary, automatically adjusts to the connected devices (e.g. to the spacing of the connection points of radiators).
- Drawing pipes as a polygonal chain reduces the number of required mouse clicks.
- Automatic insertion of radiators under windows.
- Automatic connection of radiators with bottom connection to the pipes.
- The possibility of duplicating any parts of a drawing within one storey or to the next storey.
- The ability to create a mirror image of the elements.
- The possibility of using ready-made blocks. Delivered with the software library of standard parts of a drawing (blocks) such as riser-storeys, the elements of apartment and manifold system allows for quick creation of the diagram.
- Possibility to define an unlimited number of custom blocks consisting of any parts of the drawing. Predefined blocks can be used in subsequent projects.
Designing of underfloor radiators
The program has a built-in module of underfloor radiator design. It is an integral part of the graphical system of central heating installation design. The first step in designing the underfloor heater is to define a floor structure. Directories of the program are equipped with the most popular floor heating systems, which include pipes, system boards, thermal and humidity insulation, fastening elements etc. The designer may create a whole set of structures, which will be available in subsequent projects. The program performs calculations in accordance with the EN 1264 Standard. Underfloor heating is designed based on the selected system, wet or dry and specific structure of the floor. Data characteristic for the selected manufacturer is default with possibility of individual design of the insulation.
The preliminary calculation of the heat output of the underfloor radiator can be done directly after entering the structure of the floor. This allows an approximate evaluation of thermal output of the radiator, the floor surface temperature and other parameters. The results may be useful in the design of radiators in individual rooms.
Introducing an underfloor radiator in the drawing it is enough to provide information about its type, share of the room heat load and in case of the diagram the floor area dedicated to the radiator. The program during the calculation will select the appropriate spacing of pipes in coil, will determine the actual surface and the length of the coil.
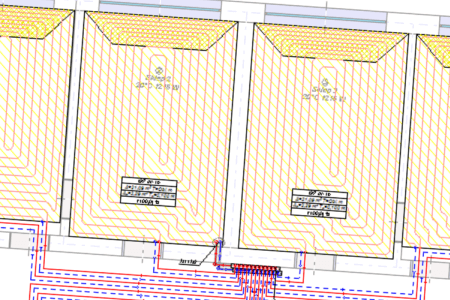
Automatic drawing of the underfloor heating coil
The program is equipped with the function of automatic drawing of a heating pipe routing scheme in a spiral system.
Coils are created in all floor heaters on floor plans, taking into account the spacing of supply and return pipes as well as the indicated spacing between the pipes wherever possible, both in the basic zone and in edge zones.
The program also performs precise calculations of the generated coil length.
Three-dimensional visualization of the installation
The function allows you to export the installation project to a file that can later be loaded into Autodesk® Revit® using the Audytor SET plugin for Revit.
The function allows you to export from the data and export from the results. Export from data allows you to save even an incomplete installation project (not recalculating), for example, the arrangement of the water risers, or the layout of the radiators. Export from results allows us to use technical data of selected pipes and devices in Autodesk® Revit®, eg pipe diameters, valve settings, radiator sizes, and pipe spacing in underfloor heating. In addition, physical quantities are available, such as the medium speed, the power of the radiator, and pressure losses.
Automatic axonometry of the installation
The program since version 7.1 has a mechanism that automatically generates the axonometric scheme of the designed installation.
Axonometry drawing can be printed or exported to DWG format, which allows to create a complete project documentation.
The axonometry schema also allows displaying the scheme of the entire installation in one drawing allowing for a more precise orientation in the project and selecting and simultaneously editing the element data on different floors, which significantly speeds up the procedure of design modification and installation adjustment.

The function of organizing zones of risers on the diagrams
In the drawing of the automatically created installation diagrams, the Organize button that has been added, enables the intelligent positioning of the zones of risers based on the data from the storey's plan views.
The program maintains the order of the risers within individual installation systems (CH, CC and H2O).
The function is particularly useful for large projects, significantly reducing the time needed to manually move the risers' zones.
The parameters of the organizing function can be modified.
Checking data and calculation results
Each inputted component is equipped with the validation and support system that allows to obtain information about the values or evokes the relevant catalogue, as well as test of data.
While entering data the program checks its correctness on an ongoing basis. This allows a significant reduction in the number of errors. During the calculation process, complete data validation takes place. As the result of that the list of errors, warnings and hints is created. The list includes the information about the significance levels and the place of the problems.
After the calculations, program analyses the obtained results. The analogue list of messages is created. Extensive system diagnostics enables the designer to fully assess the quality of the design. The program is equipped with a mechanism for quick search of where the error occurred (automatic finding a table, a row and a column with wrong data and faulty component is indicated in the drawing).
Results of calculations
The results of calculation are presented in both graphical and tabular form. Format individual system component labels can be freely modified (the selection of displayed values and style of labels).
The format of tables can be changed (selection of displayed columns and rows, font sizes) and sorted according to any key.
The tables contain the overall results and detailed results for individual devices, circuits and lists of materials and fittings.
In the drawings with results, there are labels containing the data specific for the indicated device. The form of labels is fully editable. All results available for the specific element can be put on the label. Many formats of labels can be saved and later on changed immediately.
The calculation results can be printed on a plotter or a printer. The user can select the scale of drawing and use the print preview to determine how drawings will be printed.
If the drawing does not fit one sheet of paper, the program prints it in fragments, which then can be taped together. As a result, using even the simplest A4 printer, large drawings may be prepared. The program is also capable of storing drawings in DXF or DWG files. The saved drawings can then be loaded into other software, e.g. AutoCAD.
Tables with calculation results can be printed, or exported to other applications running in Windows environment (e.g. a spreadsheet, a word processor etc.).
Designing a several installations in one project
The ability to design several systems in one project in order to design the entire system for the building at the same time.
Efficient and fast calculation process
Program is equipped with a highly efficient analysis algorithm of graph installations and efficient algorithms of selection of pipes, fittings and accessories, which allow to calculate large installations in in less than a few seconds.
Creating technical documentation
Designers can use the editor of labels, creating overview of materials and components of heating systems in order to prepare technical documentation of projects. Diagrams of heating systems can be divided into any number of drawings. Drawings themselves can be exported into the DWG format.
Technical requirements
The program runs under MS Windows (10, 11) 32bit and 64 bit.
The minimum hardware:
- 1200 MHz processor,
- 4 GB RAM,
- 2 GB of free hard disk space,
- A color monitor with a minimum screen resolution of 1024x768,
- 500 MB free space on the hard drive,
- Compatible graphics card with OpenGL 2.0 and higher: all new graphics cards on the market should meet the minimum hardware requirements;
Hardware requirements for the 3D editor
Vertical resolution requirements for the screen:
- minimum - 768 points,
- sufficient for comfortable work - 900 points,
- the most convenient - 1080 points.
Requirements for system font settings:
- Windows Vista, 7, 8 - fonts "100% smaller",
- Windows XP - "normal" fonts.
The computer should have a graphics card that supports OpenGL technology in the version:
- minimum 2.0,
- sufficient for comfortable work: 3.3 and higher.
Copyright © 2024 SANKOM Sp. z o.o.